
Building
Organizational Maturity
Random Acts of Improvement
The Scoring Guidelines [i]
I remember the first time I saw the Steps toward Mature Processes (Baldrige Performance Excellence Program). The instructor spoke of the first step as random acts of improvement. The supporting illustration has arrows going in all directions. To some, this sounds very familiar.
The subtitle to the Steps toward Mature Processes states, “An Aid for Assessing and Scoring Process Items”. The progression of maturity illustrated is (1) Reacting to Problems (random acts), (2) Early Systematic Approaches, (3) Aligned Approaches, and (4) Integrated Approaches.
As you learn to understand this progression of maturity, you will discover the best path to your own Integrated Approaches where your actions and organizational improvements are going the same direction, aligned, and bundled together in full stride toward a clear image that is depicting the organization’s strategic plan, organizational goals, and performance projections – Integrated.
Careful study of the Scoring Guidelines provides a more in-depth understanding of these maturity steps. We discussed The Scoring Guidelines in some detail in our introductory post.
- ADLI Cycle: Integration as a factor used while evaluating Processes: Four factors used to evaluate process are approach, deployment, learning, and integration (ADLI).
- LeTCI (let’s see): Integration as a factor used while evaluating Results: The four factors used to evaluate results are levels, trends, comparisons, and integration.
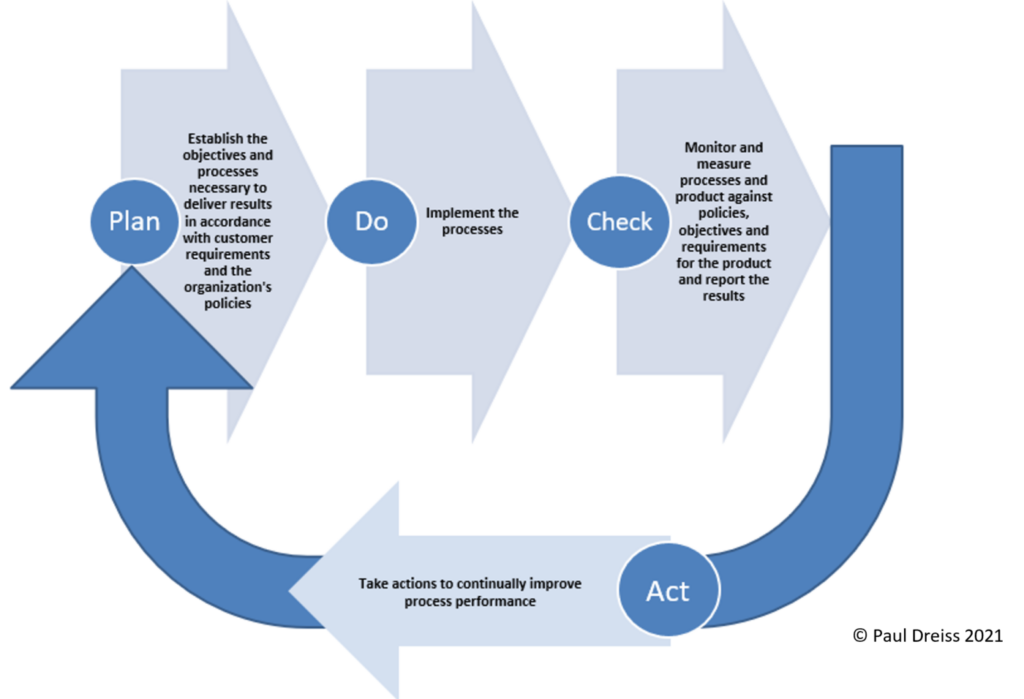
Figure 1– The PDCA[i] Cycle
The ADLI Cycle is a higher-level process when compared to the Shewhart Plan-Do-Check-Act methodology
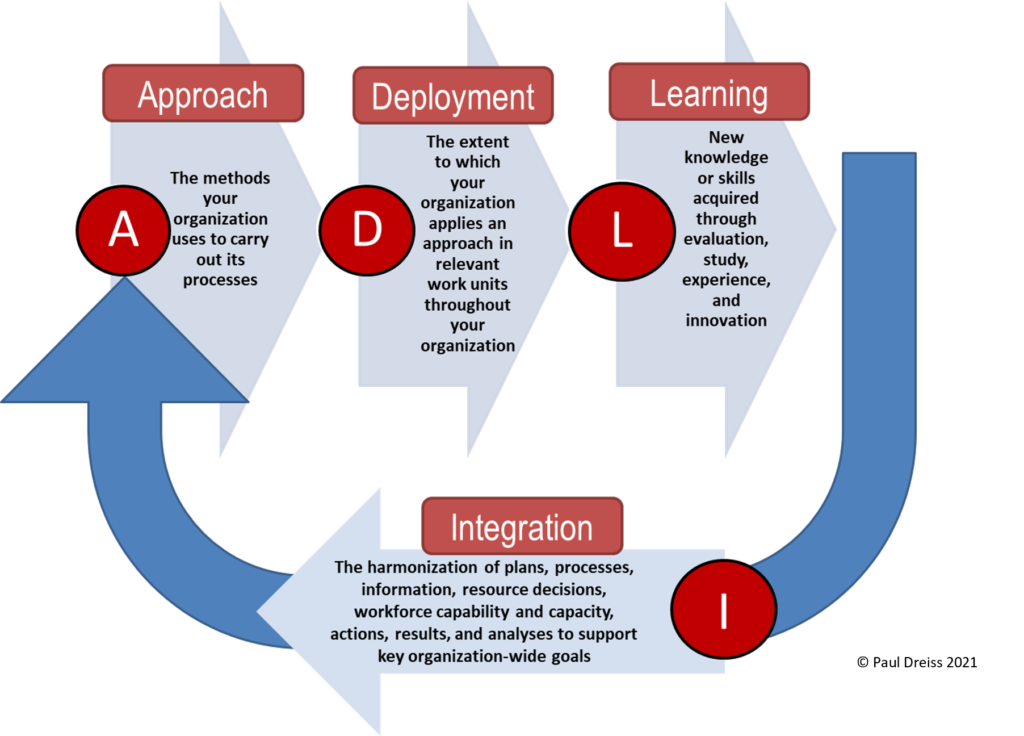
Figure 2 – The ADLI Cycle
The steps within the ADLI Cycle are:
- Approach – The methods your organization uses to carry out its processes
- Deployment – The extent to which your organization applies an approach in relevant work units throughout your organization
- Learning – New knowledge or skills acquired through evaluation, study, experience, and innovation
- Integration – The harmonization of plans, processes, information, resource decisions, workforce capability and capacity, actions, results, and analyses to support key organization-wide goals
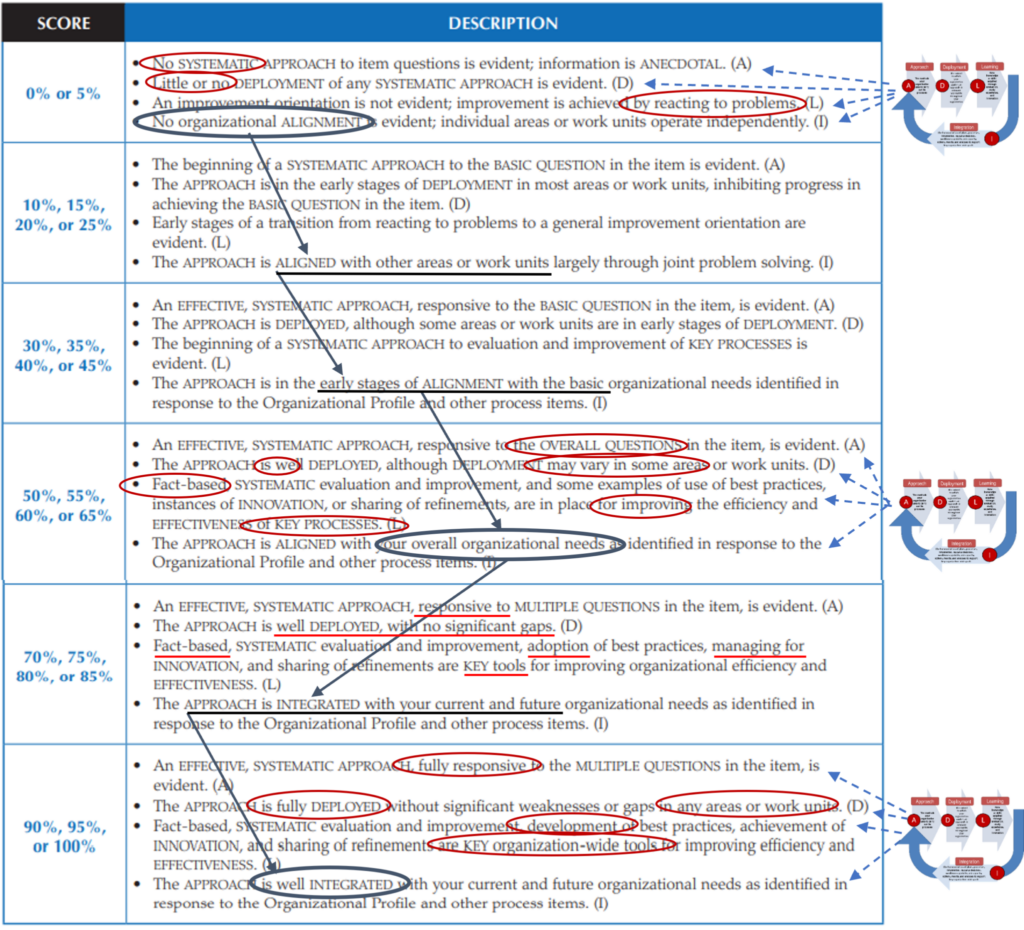
Scoring Factors for Processes
Follow the text-mapping below, or develop your own approach to find the progressive variations.
- Blue ovals, arrows, and lines trace the progression of Integration through the scoring.
- The ADLI Cycle is found in each scoring range from 0-5% to 90-100%.
- Red ovals highlight variations in three scoring ranges (e.g., 0-5%, 50-65%, 90-100%).
- Underlined text identifies the subtle difference when progressing from 70-85% to 90-100%.
LeTCI (let’s see) scoring factors for results are:
- Levels are your current performance on a meaningful measurement scale.
- Trends comprise your rate of performance improvement or continuation of good performance in areas of importance (i.e., the slope of data points over time).
- Comparisons rate your performance relative to that of other, appropriate organizations, such as competitors or organizations similar to yours, or benchmarks.
- Integration is the extent to which your results measures (often through segmentation) address important performance requirements relating to customers, products, markets, processes, action plans, and organization-wide goals identified in your processes.
Using these factors in the development of your measures will help develop insight into your results. Each graph or table of information can tell a clear and revealing story about your progress.
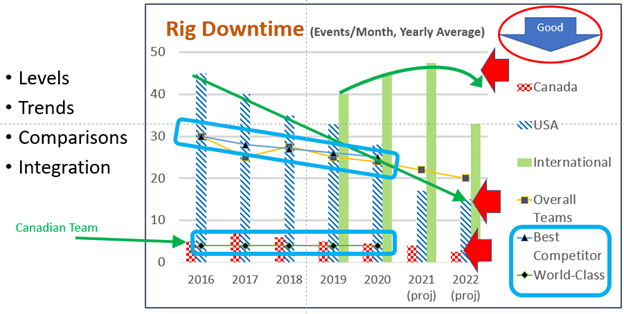
Figure 3– Graph, Example of LeTCI
Figure 3 illustrates all four factors:
- Levels are the red arrows. Projections are revealing, but be careful to not fool yourself that you are doing better than valid historical information (USA 2020 vs red arrow at 2022 data).
- Trends are the slim green arrows. Notice the blue “Good” arrow depicting desired direction of your trend results. Learning and questioning the related variations is key. For example, why is the Canadian group outperforming the other groups and why are others taking so long to come in line?
- This gets us to comparisons (blue boxes). Two things to note: Canada appears to be on track to overtake the world class comparison and the overall teams is trending along with its best competitor. Comparisons provide information to tell the full story.
- The Integration factor is more elusive to find in this graph. We may have already touched on some (e.g., variations between groups A, B and C and the levels and trends regarding comparisons), but without more information I wonder why the “world class” comparison is so outpacing its “best competitor”. The discovery of this answer will take you to processes and the ADLI Cycle. There is something to learn about a process that provides this result.
Scoring Factors for Results
Follow the text-mapping below, or develop your own approach to find the progressive variations.
- Blue ovals, arrows, and lines trace the progression of Integration through the scoring.
- LeTCI (levels, trends, comparisons, integration) is in each scoring range (0-5% to 90-100%).
- Learning the subtle progression of each scoring factor provides insight into your success.
[i] American Society for Quality – definitions for plan, do, check, act
[i] Definitions and text adapted and based on the Baldrige Criteria – 2021-2022 Baldrige Excellence Framework
Let’s Talk
We will help you overcome strategic challenges to realize the business value you seek.