
Optimize
Your Patient Communication Through Segmentation
If Your Customers are Organized into Differentiated
Segments you will be Able to….
- Gain actionable insight regarding your customers
- Customize content that speaks to them
- Time your communication appropriately
- Help your communicty get the care they need more efficiently
- Convert consideration into action more often
How do I segment all of my patients?
Conceptually this is a simple three-step process. However, in practice, there are nuances and best practices that help make this process add more value to a marketing and communication strategy.
We would love to hear about your experiences with segmentation and also share what Endeavor has learned through many years in this field.
Patient Segmentation
Intuitively, most managers and analysts know that patient and customer segmentation is critical to drawing out insights from preferences and behaviors. After all every customer has different tastes and expectations. Given that it is impractical to treat each customer differently and, also that one needs a way to cater to new customers, it is helpful to group customers into segments and tune practices to their segment’s preferences. This helps with overall patient recruitment, experience and retention. However, before leaping into the process of customer segmentation, it is valuable to think about segmentation in three steps.
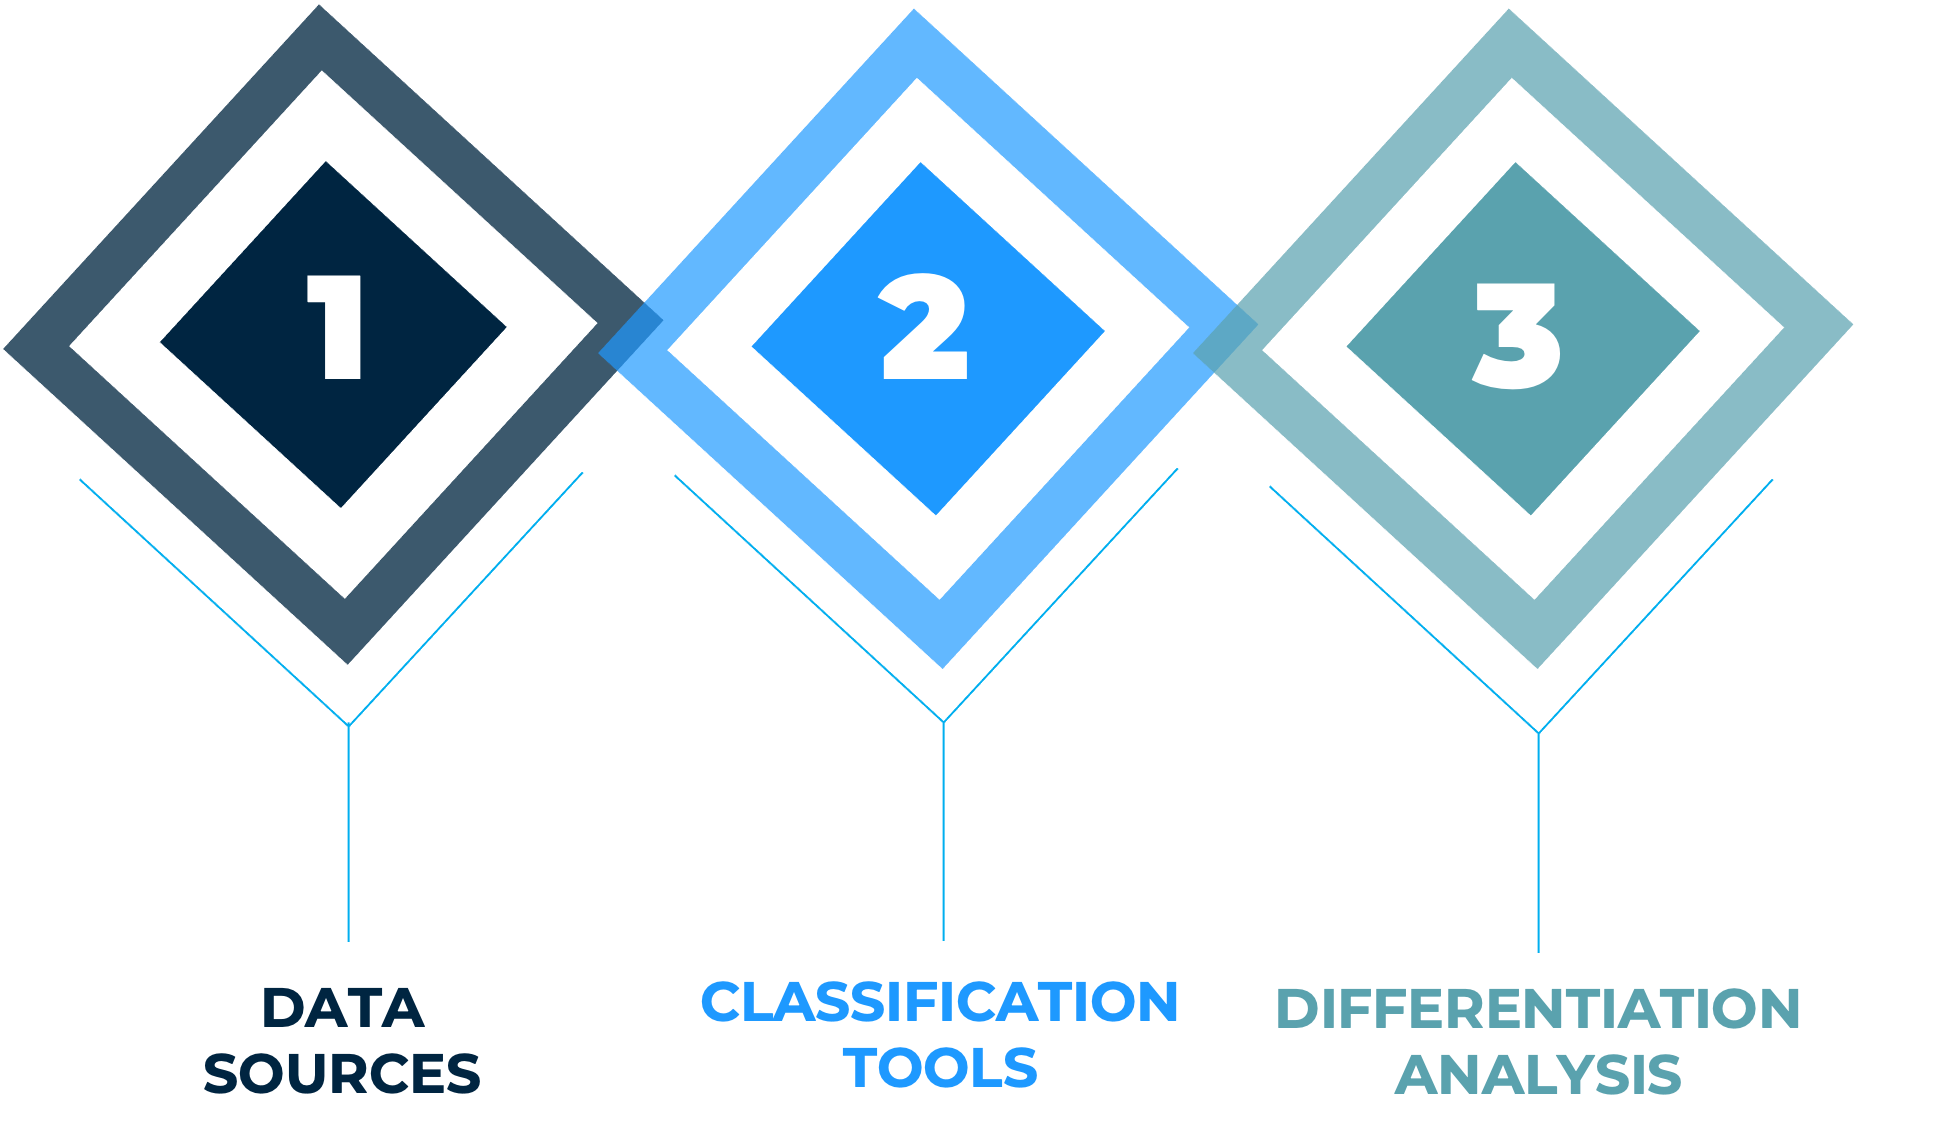

First select the type of data that is likey to segment patients into different groups.
There are four main types of data to use for segmentation:
- Demographic data (age, gender, income, education) is typically readily available and is foundational to most segmentation needs. It is also readily obtained through surveys with closed-ended questions, or through other consumer data sources.
- Psychographic data are a good complement to demographic data to identify the motivations behind consumer choices. These are typically obtained through surveys and frequently require Likert scale/differential or even open-ended questions.
- Behavioral data is often used to observe actual behaviors in purchasing, usage or retention. This may differ from stated intentions and captures real-world actions.
- Geographic data is useful at a macro level (country, state, city) to help understand differing problems and options consumers have due to location but can also be useful to differentiate between differences like urban/rural or climactic drivers

Then decside on the classification (aka typing) tool to be used for segmentation.
Typing tools usually use one of two methods of classification:
- Decision-Tree logic is a simpler typing tool and fits well when the questions in surveys have discrete responses (yes/no, a/b/c) with distinct groups. It’s also easier when there are fewer questions. Conceptually, this type of classification is easier to understand, explain and to use when there is a need to quickly classify new customers into a segment. The respondent is simply classified into a segment based on their answers to the question.
- Nearest Cluster-Centroid techniques are generally more appropriate when there are lots of questions used to create the classification, e.g., many psychographic questions to understand preferences. They are also useful when more of the questions have ordinal semi-continuous responses on a scale (e.g., rating of 1 to 5) or Likert/differential scales. Simply put, this is a more time-consuming and accurate way of typing customer segments.
Once the segments have been created, the most useful observations come from contrasting groups.
One of the most common statistical tests to compare segments and groups is the t-test to compare the means of two groups, which can also be used when not all the population parameters are known. A Z-test is also useful to determine if two populations’ means are different provided the variances are known and the sample sizes are large. ANOVA (Analysis of Variance) techniques can be used to analyze the difference between the means of more than two groups, or the impact of one or more factors by comparing the means of different samples.
There are a multitude of other analysis techniques, but most of the time, if the data sources and typing have been carried out well, the differences between segments should leap out with simple observations, and subsequently be confirmed with the above statistical tests.
The three steps above are more intuitive when analyzing with fewer factors and specific instances (e.g., how should a hospital design service to better serve a minority population by understanding what they prefer in doctor-patient interactions). However, this approach can get more complex when many factors and multi-dimensional experiences are involved (e.g., designing an overall healthcare system to cater to many different customers from awareness to experience to retention).
Nevertheless, the marketing managers’ jobs are made easier by focusing on these three aspects: selecting the right data sources, using the right classification tools and performing the best differentiator analyses. This will aid in insight generation and action planning for marketing.


Let’s Talk
We will help you overcome strategic challenges to realize the business value you seek.